

How Many New Homes Have Been Built In The Local Area?
New housing is a hotly debated subject in the UK. Despite the recent uptick in building rates, demand continues to outstrip supply and more affordable homes need to be built. The situation has improved over the last few years; the number of new homes started and finished in the UK is at a nine year high. However, forecasts show that England alone needs to build 50 per cent more homes to keep up with demand, so the issue is far from resolved. The pressure is mounting on the government to find a solution.
156,140 new homes were registered for construction in 2015, the highest it has been in eight years. This was half a per cent higher than the previous year and 45 per cent higher than 2009.
From 2014 to 2015, private sector starts increased by seven per cent, while Housing Association starts rose by five per cent. That means that since the credit crunch in 2008, the UK housing stock has grown by around five percent, which is no small feat.
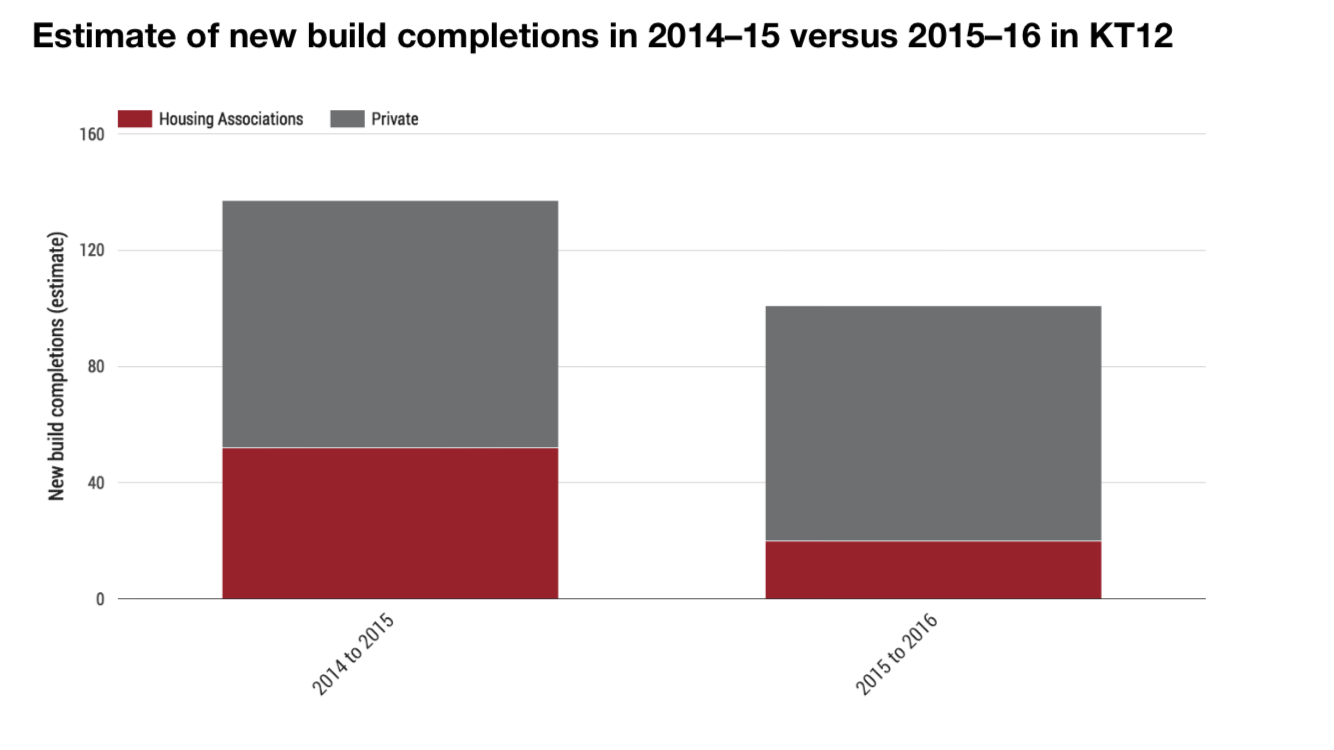
We estimate there have been 64 new build starts in KT12 in 2015–16. Over the same period, there have been an estimated 101 new properties completed. To reach these figures, we’ve applied a proportional amount of the government’s district-level house building figures to KT12 to estimate levels of new stock in the local area.
Despite all this building, the issue facing aspiring home owners is that demand for housing is still far greater than the current supply. When new build properties come on to the market they tend to be for a premium. However, there are several schemes to help buyers purchase new build homes at discounted prices. One of these is Discounted Sales, a scheme available from some councils that allows you to buy a new home at a reduced rate.
The low homes to people ratio is good news for buy-to-let landlords. With 28.9 per cent of residents in KT12 renting property, potential investors can be optimistic at their chances of finding tenants if they decide to purchase a rental property. Rental demand is high, which means void periods should be minimal.
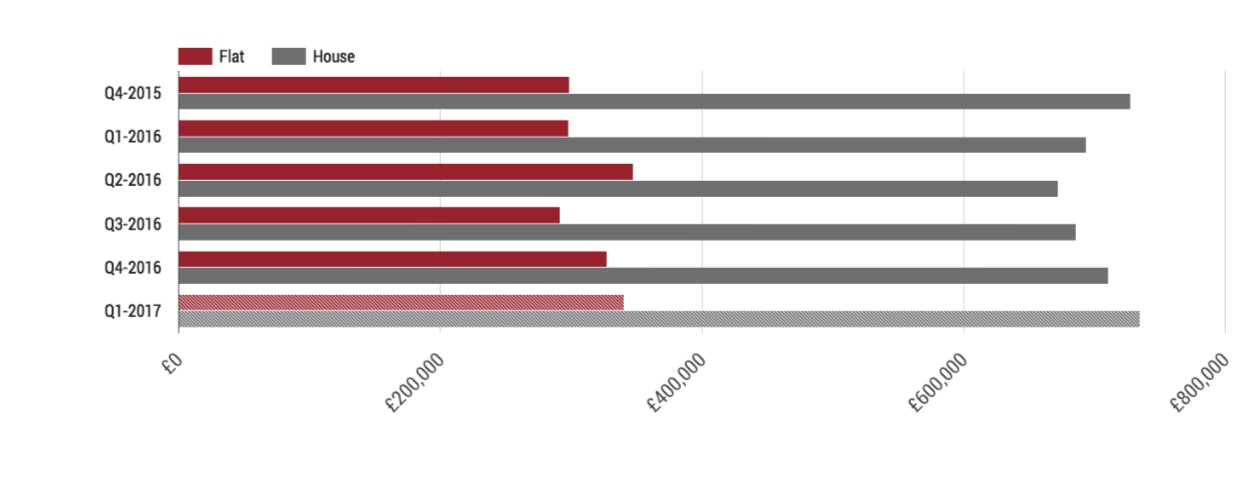
Flat And House Prices In KT12
With increasing clarity from the government, the housing market is returning to it’s usual stride. Looking at quarter-on-quarter price data in KT12, we can see that the average sold prices of flats is up 16.8 per cent since the third quarter of 2016.
Promising Sales Levels In KT12
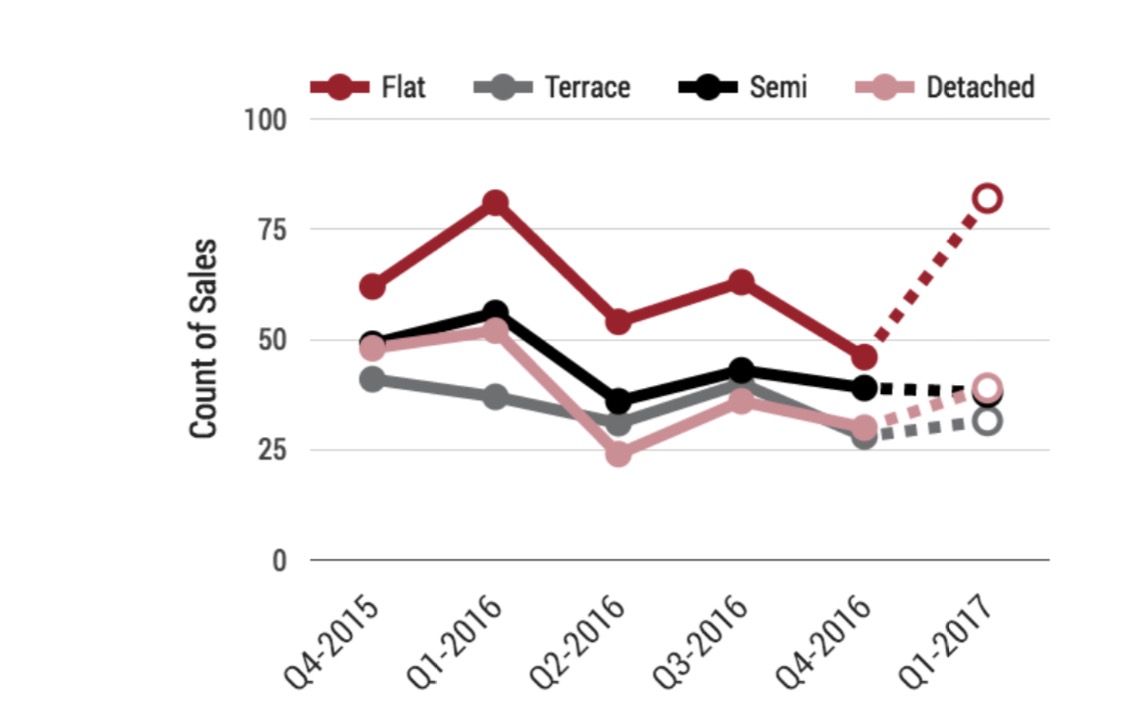 The weather may still be warming up outside, but it’s already a hot time of year for the property market. The expected uptick in sales has materialised as you can see from the chart. Particularly notable are sales levels of detached properties, which have increased 62.5 per cent since the second quarter of 2016.
Occupancy Levels In KT12
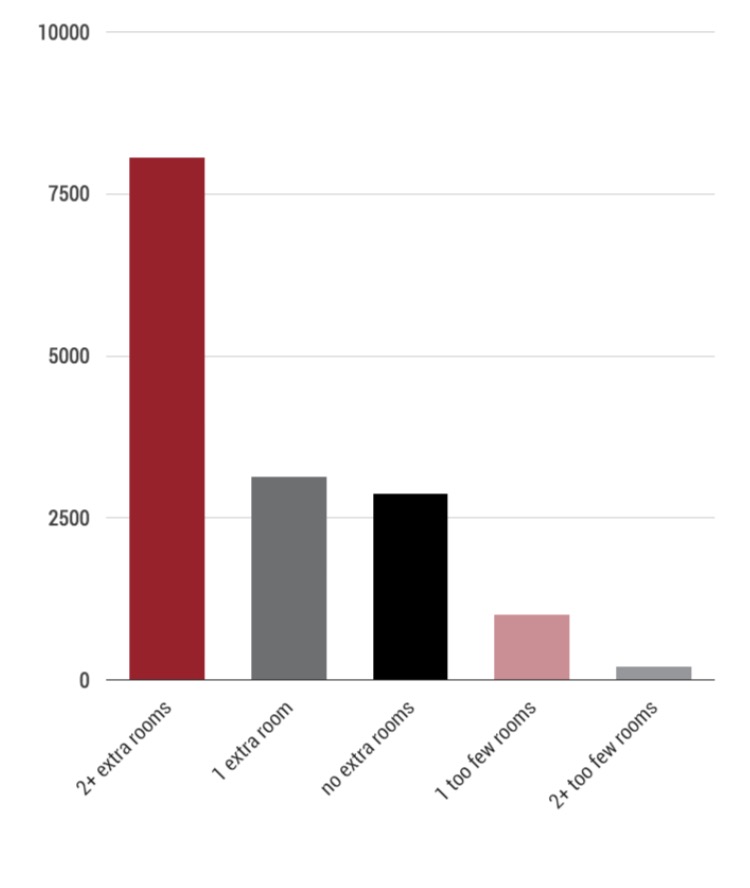
Want to know how in demand properties in a given area are? Occupancy is a useful indicator for demand, as well as illustrating how spacious or cosy properties are in the local area. In KT12, 52.6 per cent of properties have two or more extra rooms and 20.5 per cent have one extra room.
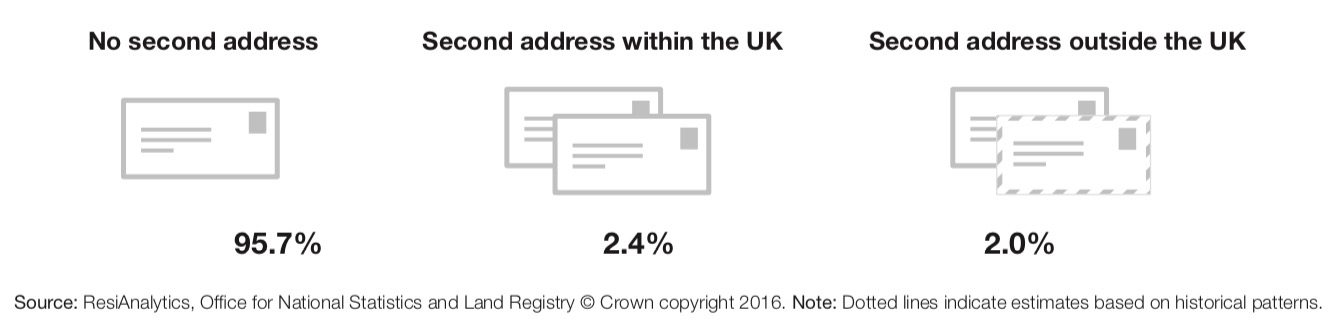
How Many Second Home Owners Are There In KT12?
The number of second homes registered in a local area can really give you a feel of if the area is right for you. In KT12, the mix is as follows:
If you would like to have a chat about new build possibilities, any other property that has taken your fancy, or you would like to sell or let your home, don’t hesitate to get in touch with us. We’d love to hear from you.