
THE KT12 PROPERTY MARKET NEWSLETTER
SEPTEMBER 2017
How often do people move property in the local area?
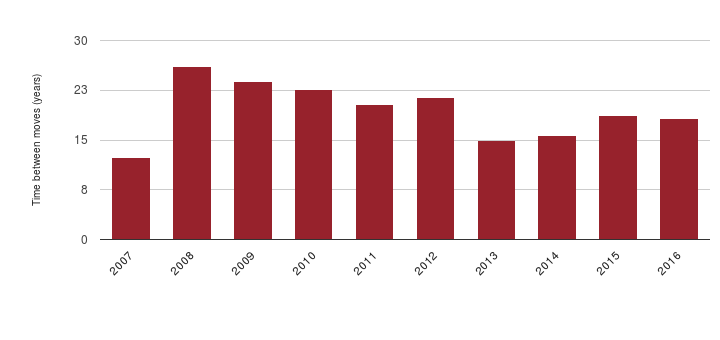
More than six-million people move home every year according to national census figures. These numbers reveal we are changing homes at a faster rate than ever before with people in the southern half of the country the most frequent movers. Conversely, those living in the North East, North West and Wales move home less frequently than anyone else in the UK.
The average lifespan of a British person is now 81.5 years; during this lifespan people will move home about six times. With 14 years, the South West leads the way for the shortest amount of time people live at one property while the longest amount of time people stay at their properties is in Wales where the average is 23 years.
The average amount of time someone lives in their property in KT12 is 18 years. This compares with 18 years in the region and 19 years nationally. We’ve calculated this by calculating turnover as a percentage of stock and estimating how long it would take for everyone to move house at least once in the area.
If people are changing their home more often, vendors will benefit from a busier market with more demand. It was once the case that only younger people would be more likely to move around, especially live-in couples, but now we are seeing a trend where people of all ages are changing their home at a more frequent rate.
The rental market moves at a much faster rate than the sales market due to 12-month contracts with a six-month break affording more flexibility. It’s also important to factor in the cheaper prices for rental properties. We are however seeing more people stay in accommodation for longer, although it’s nowhere near the length of owner-occupancy.
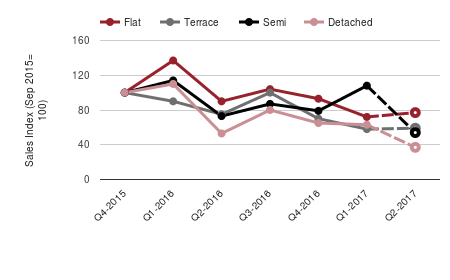
A quarterly index of sales levels
This chart shows how sales levels in the local area sit now compared with two years ago. The analysis indexes types of property so they start at the same point (100) so you can easily see how they’ve moved in relation to each other. The chart shows the quarter-on-quarter fluctuations typical of local analysis, it also shows how the market has been affected by seasonal change.
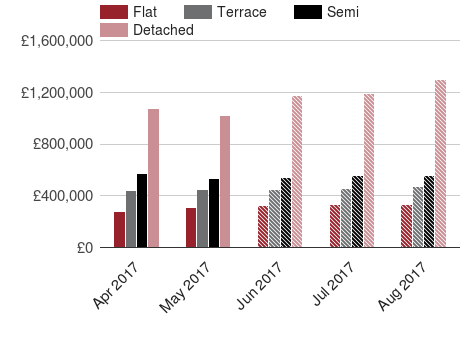
Monthly prices by property type
The data for our area over the last five months reveals interesting fluctuations across property types. The last 3 months are coloured with stripes. This is because the data is still coming in so we’ve estimated what we think they will be when all the data is available.
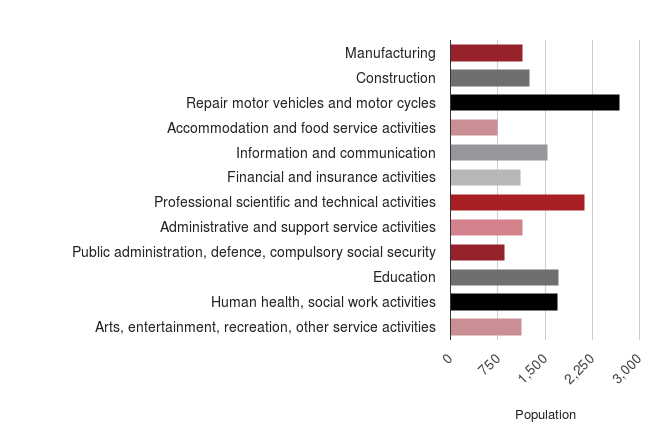
Industry of occupation
The profile of jobs is a important yardstick for the makeup of people in a housing market. In this analysis we’ve used data from the Office for National Statistics on the number of people in the local area who work in each industry. The categories are a bit vague but if you look at the longest bars, you can see a pretty good profile of our area.
Whether it is because people have more money, have benefited from the rise in house prices, or prefer a change of scenery, the rate at which people are moving homes is rising. If you would like to know more about the property market in KT12, don’t hesitate to get in touch with us. You can also join the Walton Property Community group on Facebook for more local property news, updates and open discussion. We look forward to hearing from you.
Source: ResiAnalytics, Office for National Statistics and Land Registry © Crown copyright 2016. Note: Dotted lines indicate estimates based on historical patterns.